Measure, Incentivize & Learn
Involve Stakeholders to Choose Measures & Goals
Design a metric around something everyone wants to be done: incentivize to do good.
– Chief of Psychiatry and former Medical Director, Brookwood site
Investing clinic resources to bring about large-scale change requires buy-in from leadership and staff. They will want to know whether the efforts are paying off. To find out you will need data. Performance measurement allows you to know and report the extent of the project’s success and to identify opportunities for improvement.
During the project’s planning stages, you’ll want to determine the performance measures that will be most pertinent and useful. Deciding on these metrics is best approached by thinking about everyone who will be impacted by the project, from leadership to administrators, providers, medical assistants, and front desk staff. Consider the following factors when choosing what to measure:
 |
Choose measures that clearly align with overall project goals. These may be bottom line measures such as the percentage of all patients with a lifetime test. They may be interim process measures such as the percentage of patients receiving educational materials from front desk staff. Aligning the measures well helps to ensure that staff care about the results. |
 |
Think about all levels of staff. For example, we met with clinic directors at many sites to find out what their teams cared most about. |
 |
Select data that can feasibly be collected without burdening staff. When modifying your EHR to adjust to new workflows, structure data fields to provide you with the data you need to measure performance. Data needs to be reliable and complete, or no one will value results or the reports that use it. |
 |
Be sure to collect baseline data so you know how you were doing before the project began. |
 |
Also keep other stakeholders in mind. What might you want to report to funders or patients about this project? How do you want to frame your performance? Think about how you want to present the material later on and then work backwards to the exact data you need for such presentations. |
We set a variety of goals along the way. Our overall goal was to test 75% of all patients age 15 and older by December 2017, with a larger goal of continuing ongoing testing beyond that. We also set interim goals, such as the number of tests completed each year and month of the project. These helped us assess whether we were staying on track to meet the larger project goal.
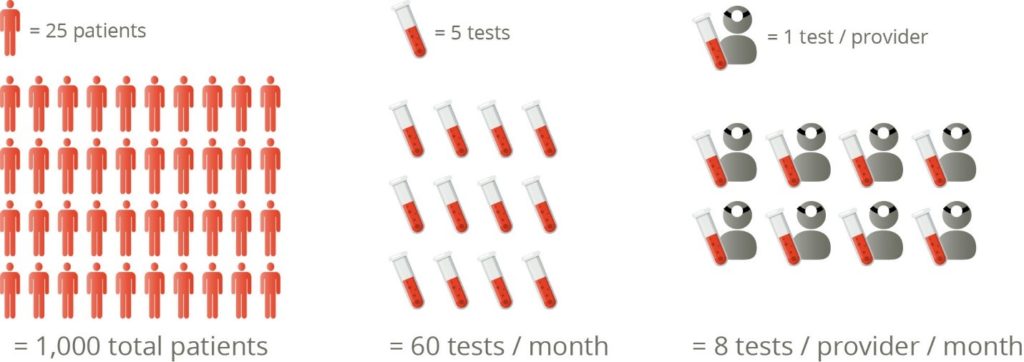
In addition, we set individual site goals that aligned with the overall 75% goal. For example, for a pair of sites that operated in tandem, we looked at their total patient numbers and calculated they would need to test 1000 patients by the end of the project. To make that goal less overwhelming, we broke it down to 60 tests per month, or 8 tests per provider per month. This translated into each provider adding a single test each day to reach the goal.
We also allowed sites to set their own goals if they had unique situations or barriers. And we created goals for the MA level as well as the provider level.
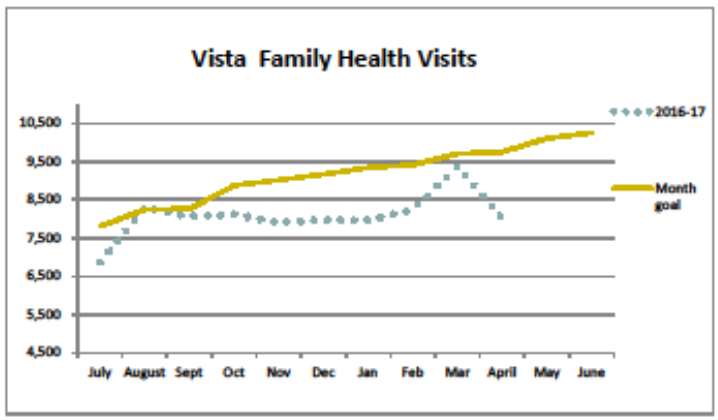
Figure 8. Sample report showing monthly goals
Build Performance Reports
Once you know what you are measuring and what goals you are setting, you can work with your data analytics staff to create performance reports. This may not be feasible until other EHR modifications are made, since the new data fields you’re adding may be needed for the report.
Think about the different levels of reporting you might need. You’ll want to know how the agency overall is performing, how each site is performing, and how each provider is performing with their empaneled patients. You may want to provide each clinician with their own data report, or produce a report showing all providers together as way to encourage friendly competition as well as communication about best practices.
Think about the structure of the reports. What timeframe should they cover? Do you always want to show progress over time, or do you want to simply share the most recent month’s results? Consider how the reports will be viewed: posting on a “quality bulletin board” might call for bottom line results only, while review of data at a staff meeting might allow for a deeper dive into more levels of information.
Be sure to validate your reports. Doublecheck calculations and field names. Compare individual chart results with the report to make sure it’s pulling the data you think it is. It’s discouraging for everyone to discover that a circulated report is inaccurate and doesn’t reflect what’s really going on.
Share Results Regularly
Honestly, I think weekly reports being run and letting people know how the rate is week by week could help keep this at the forefront of considerations for us in the clinic and to ensure that we know when mistakes are occurring.
– Medical Assistant
Sharing results with staff on a regular basis might be one of the single most effective keys to success. It communicates current progress or lack thereof. Spending time reviewing performance means that the project is worth spending time talking about it; it lets staff know the project is a priority and keeps it on the collective radar. Additionally, once the data reflect progress towards your goals, staff may find it motivational to see their efforts reflected in reports.
We began with regular in person updates and data sharing at each site staff meeting over the project’s first six months. We transitioned to monthly email updates along with extra communications on certain special occasions such as World AIDS day. Future updates may come in the form of self-generated reports easily accessed on our Intranet using a new data analytics package.
Here’s a look at some of the ways we shared results:
 Dashboards and report cards. We added HIV testing data to our leadership, site leadership, and provider dashboards, and created team and provider report cards so individual providers could find out how they were doing with their patient panel. The dashboard supports sustainability since HIV testing will be viewable on the dashboards indefinitely. Team and provider-level reports are the most meaningful for individual staff and providers, while leadership may be more interested in site-level or even just bottom-line results.
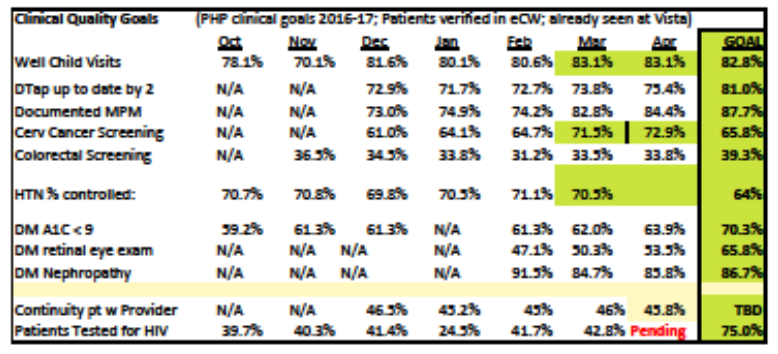
Figure 9. Sample leadership dashboard with HIV testing data on bottom row
- Staff and committee meetings. Our project champion attended monthly quality improvement and data meetings, monthly site meetings, and any other provider meetings where we could share data and promote awareness of the project. We shared all levels of performance data including site- and provider-level. In-person discussions at meetings are a highly useful way to keep the project on people’s minds, and also the best venue for discussions about high and low performance (see Learn from the High and Low Performers below). Unfortunately, meeting attendance can be time consuming, and the project faced competition for agenda space with other priorities. It may not be a sustainable strategy over time.
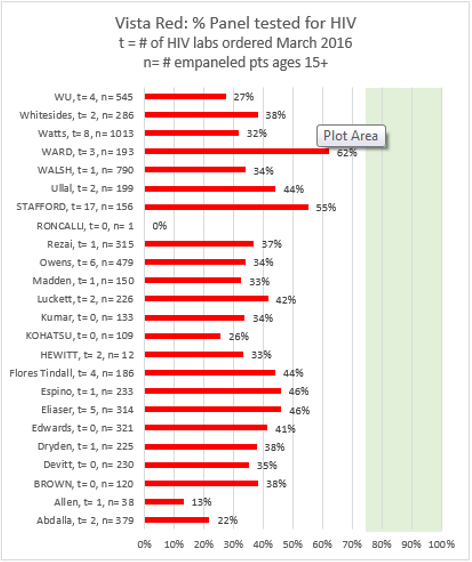
Figure 10. Sample provider-level data
- Site bulletin boards. Each site has a bulletin board called the “QI Corner” where monthly performance results are posted and kept up-to-date. This provides a venue for staff to peruse results at their own pace, as compared to discussions in a meeting setting. It’s also a public setting where site, team and provider results can be used to encourage friendly competition as well as communication on best practices.
- Emails to leadership and staff. When in-person presentation of results was no longer feasible, we transitioned to monthly emails, supplemented by additional emails on special dates like World AIDS Day. These allowed for the sharing of actual data along with reminders about incentives and other useful updates about HIV testing.
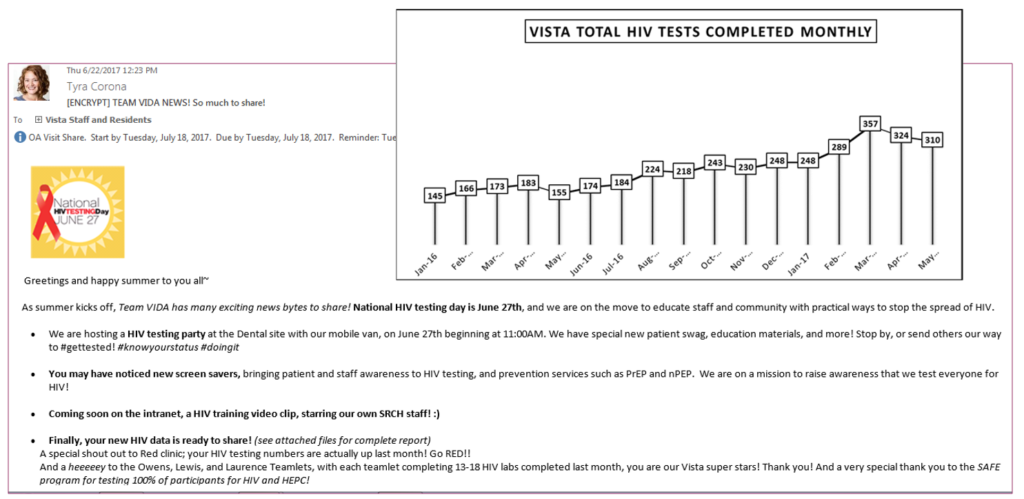
Figure 11. Sample staff email containing performance results
- Annual provider evaluations. Providers have an annual review of all their performance measurements, and we added HIV testing to their list.
- Other promotional communications. We also posted overall results in staff newsletters and on our Intranet home page as a way to keep everyone informed and inspired.
Ongoing access via data analytics tools. One of our planned methods for distributing results is the use of a new data analytics tool. Once implemented, it will offer a user-friendly way for clinic sites, teams and providers to proactively seek out and understand their own data and results on our agency Intranet. We plan to include HIV testing data in the analytics dashboard to keep it front and center on people’s minds.
![]() However, you decide to distribute performance results, the more you can systematize the distribution, the more sustainable the effort will be. Relying on extra efforts from your project champion means that if they move on or become too busy, no one may know about current results and wrongly infer that the project is no longer a priority. On the other hand, if results are permanently added to leadership and staff dashboards, staff will understand that opt-out HIV screening is an integral element of ongoing care.
However, you decide to distribute performance results, the more you can systematize the distribution, the more sustainable the effort will be. Relying on extra efforts from your project champion means that if they move on or become too busy, no one may know about current results and wrongly infer that the project is no longer a priority. On the other hand, if results are permanently added to leadership and staff dashboards, staff will understand that opt-out HIV screening is an integral element of ongoing care.
Incentivize Everyone
Data brings out people’s competitive spirit in a good way.
– Site Director, Lombardi site
Along with keeping everyone informed about their performance, it is helpful to provide incentives to improve. While understanding the importance of HIV testing certainly counts as an incentive, sometimes a more personal enticement helps to get everyone invested in making change. Here are a few ways to approach incentivizing:
 |
Incentivize through recognition. Recognizing strong performers in front of their peers is usually valued more highly than any tangible reward you might be able to offer. Find a consistent (e.g. monthly, quarterly) way to publicly acknowledge top performers. You can also offer them a tangible reward, and use the acknowledgement as an opportunity for others to learn from their success and to let their likely positive attitude towards HIV testing influence the rest of the team. |
 |
Incentivize with goodies. Tangible rewards don’t have to be extravagant. They provide recognition of a job well done, emphasizing the value of good work in lieu of substantial financial rewards.
Examples of goodies include providing the top three performers with $5-10, enough for a coffee or snack, Starbucks cards in the equivalent amount, or gift cards to local establishments. We also entered staff with a high monthly testing rate into a raffle for a slightly more substantial prize. And we provided lunch for sites that met their self-selected goals, letting us reward all staff at once and celebrate the project at the same time. |
 |
Incentivize at all staff levels. Providers are usually the main target of incentives, but it’s also helpful to incentivize MA’s and front desk staff. It sends the message that HIV testing is a team effort, and invests everyone in the project. It reinforces the importance of the project. For example, at the end of each month or quarter, we provided goodies to front desk staff who handed out the most HIV testing information cards to patients. |
Learn from Low and High Performers
A lot of people use data punitively. Our project champion was never judgmental. She was just inquisitive about why the numbers were the way they were.
– Chief of Psychiatry and former Medical Director, Brookwood site
Another key to success is to be positive when discussing performance. Use meetings as an opportunity to discuss performance, whether it’s good or bad. Highlight good performers and have them share the secrets of their success with other teams and maybe even other sites. As our project champion says, try to send the message that, “You guys are already doing a great job and if you want to get even better, pay attention to what these superstars are doing!”
Even when meeting discussions aren’t possible, it is helpful to celebrate the good news when distributing performance results. Beyond framing things positively, be sure staff have all the resources they need to succeed. Provide gentle reminders about available tools and their use.
Conversely, it’s important to learn about the reasons for poor performance. Approach these discussions non-judgmentally, from a team-based point of view, and with the goal of understanding remaining barriers and figuring out how to address them.
A Quick Clinic Story: Becoming a Data-Driven Organization At the start of the HIV Testing Project, Santa Rosa Community Health was not really a data-driven organization. There was no template or standard for how to share data beyond the leadership level. The majority of staff was not used to looking at data regularly, so we had no idea how they would receive the HIV testing reports we compiled. On top of that, we were in the midst of a huge empanelment issue, where many hands were on deck to clean up the provider panels, removing inactive patients and properly assigning patients to the provider who sees them most often. In addition, we suffered some key staff turnover. Despite these challenges, we pressed ahead, working with staff to determine the best format for reports, working with others on cleaning up the data to make it reliable, and coordinating with leadership on the best ways to distribute the information. This process contributed greatly to the organization’s overall progress in learning how to use data to improve performance.
Resources
- Sample slides presenting results at one site with different units (PDF)
- Sample slides presenting results at one site with different units (.pptx)
- Sample slides presenting results at two sites, along with incentives and reminders (.pdf)
- Sample slides presenting results at two sites, along with incentives and reminders (.pptx)
- Sample slides presenting results at two sites, along with incentives and reminders (.pdf)
- Sample slides presenting detailed results at one site (.ppt)